この記事は、リレーブログ企画「24新卒リレーブログ」の記事です。
はじめに
こんにちは。
初めまして、新卒1年目のけにです。
現在OJT期間で課金システムチームに所属しており、社内向けのAPIの開発に携わっています。そのAPIに対して負荷テストを行うにあたり、チーム内で負荷テストツールとしてk6を採用するという話になりました。
k6は簡単にテストシナリオを書けるツールでありながら、非常に強力な負荷テストを実行することができます。本記事では、そのk6について基本的な使い方からinfluxDBとGrafanaを用いた結果の可視化方法まで、調べた内容について自分の理解の整理も含めて記事にしたいと思います。
負荷テストを行う理由
現在のAPI開発において、ユーザー数の急激な増加や予期しないトラフィックの集中が起こることを想定し、それら状況下においてもシステムが安定して機能することが求められます。そのため、パフォーマンスの検証、限界値の測定、リソース使用状況の把握など、対象のシステムの品質や信頼性、リソースの最適化などを目的とする負荷テストは非常に重要な役割を持ちます。
今回私達のチームでは、開発したAPIが実用に耐えうる構成となっているのかについて実際のアクセス数を元に確認することを主な目的として、スパイクテストとストレステストを行いました。
- 想定される範囲で急激な負荷の上昇が起きたとしても想定通りの速度が出せるか
- 想定される以上の高負荷がかかった場合でもAPIは正常に動き十分なレスポンス速度を出すことができるか
- 長時間負荷がかかった場合にどのような挙動をするのか
などです。また、負荷テストを実行した際に
- CPUやメモリなどのリソースは現在の構成で適切なものになっているか
- API / サーバーの設定は適切なものになっているか
についても確認を行いました。
これらにより、システムの限界値や潜在的な問題点を事前に把握し必要な対策を講じることで、システムの品質と信頼性を向上させユーザー満足度を高めることに繋がります。
ツールの選定
負荷テストを行うことができるツールは様々あります。
それらのうち、無料で利用できる7つを比較してみます。
| ツール名 | 公式 | シナリオ記述言語 | 結果確認 方法 | 詳細 |
|---|---|---|---|---|
| k6 | k6.io, github | JavaScript | grafana / CUI / Cloud | Golangで開発され、高負荷環境でもスムーズに動作、拡張性が高い |
| Apache Bench | apache.org | CLI | CUI | 単一のURLへのリクエストを生成するツールのため、シナリオベースでWebアプリケーションをテストすることには向いていない |
| Apache JMeter | jmeter.apache.org, github | GUI / Java | GUI | 拡張性が高く、結果可視化方法が豊富 |
| Tsung | tsung, github | XML | tsung-recorder | Erlang言語で開発され、データベースやメッセージングシステムのテストを行える |
| Gatling | gatling.io, github | Scala | .html | JavaVM上で動作 |
| Vegeta | vegeta, github | Golang | .html / plotコマンド | 同時接続数やリクエストレートの詳細な制御が可能 |
| Locust | locust.io, github | Python | webサーバ | スケーラブルで、分散実行が可能 |
私達のチームでは、主にPythonを使用していることから Locust と、今後チーム内に導入するにあたって学習コストが低い JavaScript で記述でき、現在も盛んに開発が行われている k6が選択肢に上がりました。それらの内、OSSでアップデートが盛んに行われているため新しい技術に対応可能である点から、k6を採用することにしました。
実行環境
準備
今回は以下のGrafanaが用意しているk6のリポジトリを使用します。
k6で行った負荷テスト結果をinfluxDBに保存し、Grafanaを用いて可視化します。
|
1 2 |
# clone git clone https://github.com/grafana/xk6-output-influxdb.git |
エンドポイントについては、今回はこちらを使います。

これは、k6 の実験用HTTP、 WebSocket API のコレクションとなっています。
このうち https://test-api.k6.io/public/crocodiles/{id} に対して負荷テストを行います。
注意点として、これは共有テスト環境であるため高負荷テストは避ける必要があります。
APIの挙動
curlコマンドを用いて一度APIを叩いてみます。
叩くことができるidの一覧は以下の結果のとおりです。
|
1 |
curl https://test-api.k6.io/public/crocodiles/ |
|
1 2 3 4 5 6 7 8 9 10 11 12 13 14 15 16 17 18 19 20 21 22 23 24 25 26 27 28 29 30 31 32 33 34 35 36 37 38 39 40 41 42 43 44 45 46 47 48 49 50 51 52 53 54 55 56 57 58 59 |
[ { "id": 1, "name": "Bert", "sex": "M", "date_of_birth": "2010-06-27", "age": 14 }, { "id": 2, "name": "Ed", "sex": "M", "date_of_birth": "1995-02-27", "age": 29 }, { "id": 3, "name": "Lyle the Crocodile", "sex": "M", "date_of_birth": "1985-03-03", "age": 39 }, { "id": 4, "name": "Solomon", "sex": "M", "date_of_birth": "1993-12-25", "age": 30 }, { "id": 5, "name": "The gharial", "sex": "F", "date_of_birth": "2004-06-28", "age": 20 }, { "id": 6, "name": "Sang Buaya", "sex": "F", "date_of_birth": "2006-01-28", "age": 18 }, { "id": 7, "name": "Sobek", "sex": "F", "date_of_birth": "1854-09-02", "age": 169 }, { "id": 8, "name": "Curious George", "sex": "M", "date_of_birth": "1981-01-03", "age": 43 } ] |
それを元に対象のAPIを叩いてみます。返却値は以下のようになっています。
|
1 |
curl https://test-api.k6.io/public/crocodiles/1/ |
|
1 2 3 4 5 6 7 |
{ "id": 1, "name": "Bert", "sex": "M", "date_of_birth": "2010-06-27", "age": 14 } |
プロキシ設定の変更
本リポジトリでは、k6 → influxdb → grafana の順にデータが送られます。
コンテナ間の通信が発生するため、~/.docker/config.json にproxyが設定されていると503エラーとなる可能性があります。そのため、設定をしている人は修正が必要になります。
シナリオ
シナリオの選定
条件毎に、必要なシナリオに応じてパターンを考える必要があります。
特にGrafanaでは、負荷テストの種類を6つ挙げています。(参考
| テスト名 | 時間 | 内容 |
|---|---|---|
| Smoke test | 数分、数秒 | 最小限の負荷でシステムの機能を検証し、基準となるパフォーマンス値を収集するテスト |
| Average-load test | 中(5〜60分) | 標準的な負荷下でシステムがどのように動作するかを評価するテスト |
| Stress test | 中(5〜60分) | トラフィックのピーク時の負荷でシステムがどのように機能するかを調べるテスト |
| Spike test | 長時間 | 突然の使用状況の急増に対してシステムが耐えて機能するかどうかを検証するテスト |
| Breakpoint test | 数分 | システムの限界を計測するために行うテスト |
| Soak test | 必要な限り | 数時間から数日の長期間行う平均負荷テスト |
シナリオの実装
k6 テスト スクリプトでは、load_test.js内のoptionsオブジェクトを使用してシナリオを構成できます。
各シナリオには一意の名前を付け、executor タイプとその構成を指定する必要があります。
|
1 2 3 4 5 6 7 8 9 10 11 12 13 14 15 16 17 18 |
export const options = { scenarios: { spike: { executor: "ramping-vus", startVUs: 0, stages: [ { duration: "5m", target: 100 }, { duration: "2m", target: 0 }, ], }, stress: { executor: "constant-vus", vus: 50, duration: "10m", }, }, }; |
上記は、スパイクテストとストレステストの例です。
- スパイクテスト
ramping-vus executorを使用- 仮想ユーザーの秒間アクセス数を5分掛けて 0 から 100 まで徐々に増やし、2分掛けて 0 まで減らしている
- ストレステスト
constant-vus executorを使用- 10 分間、秒間50回の仮想ユーザーからのアクセスを保っている
シナリオを複数指定している場合、上から順に実行されます。
executorには他にも種類があり、それぞれ記述方法が異なります。
参考:https://k6.io/docs/using-k6/scenarios/executors/#all-executors
負荷テストの実行
今回は上記のうち、ストレステストとスパイクテストを行ってみます。
実行コード
|
1 2 3 4 5 6 7 8 9 10 11 12 13 14 15 16 17 18 19 20 21 22 23 24 25 26 27 28 29 30 31 32 33 34 35 36 37 |
import http from 'k6/http'; // スパイクテストの設定 export const options = { scenarios: { // スパイクテスト // 短時間で一気に負荷が上昇した場合の負荷テスト spike: { executor: 'ramping-vus', startVUs: 0, stages: [ { duration: '2s', target: 10 }, { duration: '1m', target: 0 }, ], }, // ストレステスト // 短時間で一気に負荷が上昇した場合の負荷テスト stress: { executor: "constant-vus", vus: 50, duration: "10m", }, }, }; export default function () { // APIリクエストを送信 const id = Math.floor(Math.random() * 8); const response = http.get(`https://test-api.k6.io/public/crocodiles/${id}`, { tags: { "id": id, "all": "all" } // Grafana表示用にタグを設定 }); // レスポンスをチェック console.log(`VU: ${__VU}, Iteration: ${__ITER}, ID: ${id}, Status: ${response.status}`); } |
|
1 2 3 4 5 |
# コンテナの起動 ## k6以外を立ち上げる docker compose up influxdb grafana -d # テスト実行 docker compose run --rm -T k6 run - < samples/load_test.js |
起動画面
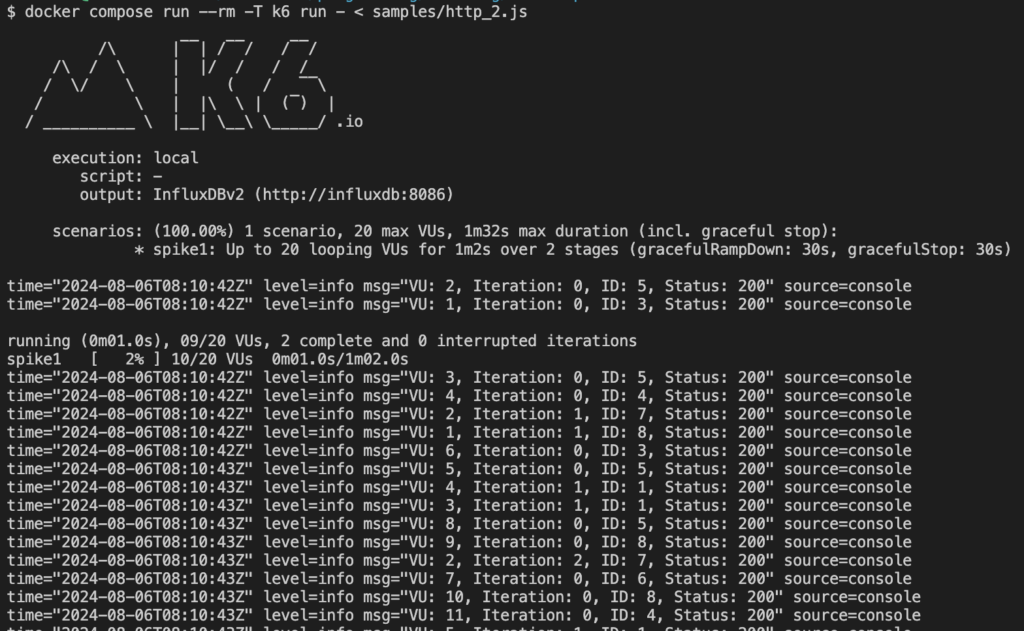
結果の確認
1. k6
実行結果
確認できるメトリクスは以下の通りになります。
| メトリクス名 | 説明 |
|---|---|
| data_received | 受信したデータ量 |
| data_sent | 送信されたデータ量 |
| http_req_blocked | リクエストを開始するまでにブロックされた時間 |
| http_req_connecting | リモートホストとのTCPコネクションの確立にかかった時間 |
| http_req_duration | リクエストを送ってから帰ってくるまでの時間 ( http_req_sending + http_req_waiting + http_req_receiving) |
| http_req_failed | リクエストに失敗した数 |
| http_req_receiving | リモートホストからの応答データ受信にかかった時間 |
| http_req_sending | リモートホストへのデータ送信にかかった時間 |
| http_req_tls_handshaking | リモートホストとのTLSセッションのハンドシェイクにかかった時間 |
| http_req_waiting | リモートホストからの応答待ち時間 |
| http_reqs | 生成した HTTP リクエストの合計数 |
| iteration_duration | 1回のイテレーションの実行に要した時間 |
| iterations | virtual usersが実行したデフォルト関数の回数 |
| vus | virtual users、同時にアクセスする仮想ユーザー数 |
| vus_max | 仮想ユーザーの最大可能数 |
特に確認する必要があるのは http_req_duration , http_reqs, http_req_failedの3つです。
リクエストにかかった時間、リクエストの数、失敗した数です。
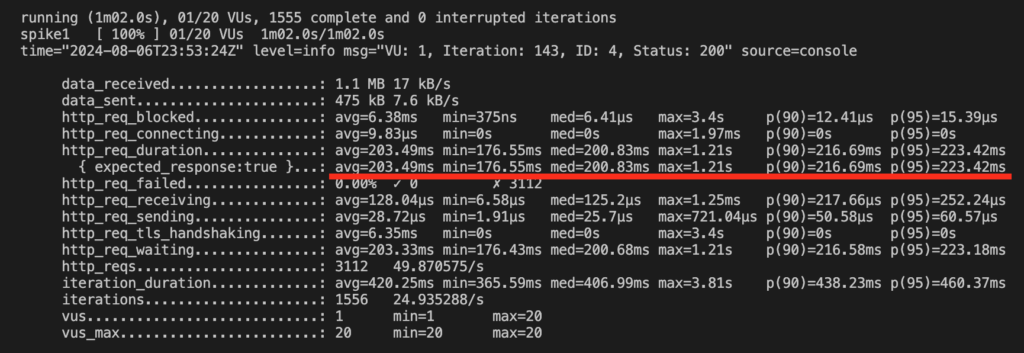
この結果から、このAPIのレスポンス速度は約200ms程度であり、ほとんどの場合に於いてその速度を出していることがわかります。
| 平均値 | 最小値 | 中央値 | 最大値 | 90パーセン タイル | 95パーセン タイル | 成功数 | 失敗数 |
|---|---|---|---|---|---|---|---|
| 203.49ms | 176.55ms | 200.83ms | 1.21s | 216.69ms | 223.42ms | 3112回 | 0回 |
2. grafana
コンテナを立ち上げた際に立ち上がっているため、そちらにアクセスします。
アクセス先:http://localhost:3000/dashboards
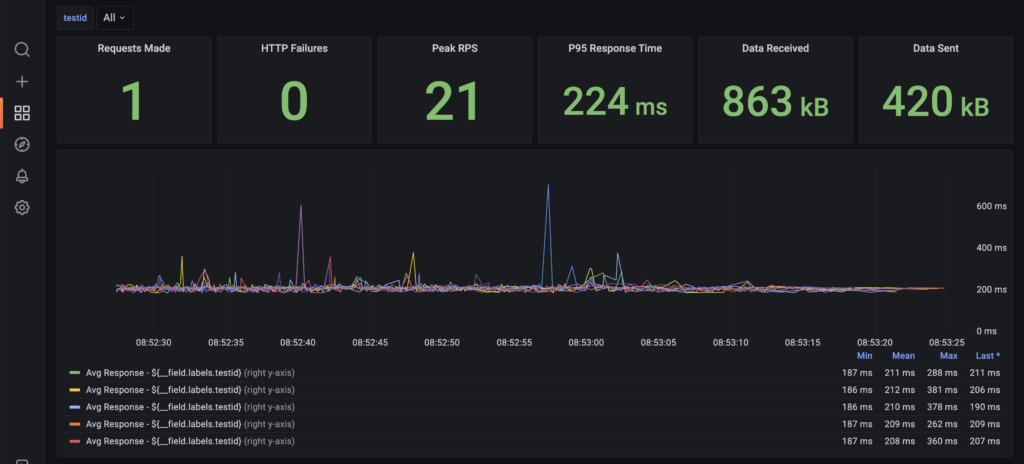
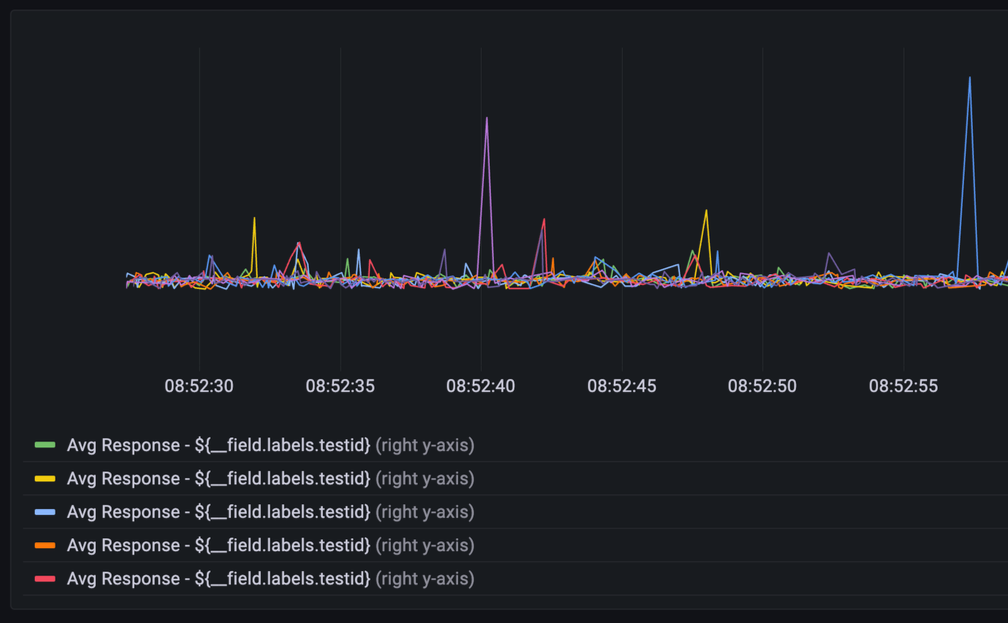
これでは結果が分かりにくいため、凡例とクエリを修正します。
修正先:grafana/dashboards/xk6-output-influxdb-dashboard.json
▶︎ 修正コード
|
1 2 3 4 5 6 7 8 9 10 11 12 13 14 15 16 17 18 19 20 21 22 23 24 25 26 27 28 29 30 31 32 33 34 35 36 37 38 39 40 41 42 43 44 45 46 47 48 49 50 51 52 53 54 55 56 57 58 59 60 61 62 63 64 65 66 67 68 69 70 71 72 73 74 75 76 77 78 79 80 81 82 83 84 85 86 87 88 89 90 91 92 93 94 95 96 97 98 99 100 101 102 103 104 105 106 107 108 109 110 111 112 113 114 115 116 117 118 119 120 121 122 123 124 125 126 127 128 129 130 131 132 133 134 135 136 137 138 139 140 141 142 143 144 145 146 147 148 149 150 151 152 153 154 155 156 157 158 159 160 161 162 163 164 165 166 167 168 169 170 171 172 173 174 175 176 177 178 179 180 181 182 183 184 185 186 187 188 189 190 191 192 193 194 195 196 197 198 199 200 201 202 203 204 205 206 207 208 209 210 211 212 213 214 215 216 217 218 219 220 221 222 223 224 225 226 227 228 229 230 231 232 233 234 235 236 237 238 239 240 241 242 243 244 245 246 247 248 249 250 251 252 253 254 255 256 257 258 259 260 261 262 263 264 265 266 267 268 269 270 271 272 273 274 275 276 277 278 279 280 281 282 283 284 285 286 287 288 289 290 291 292 293 294 295 296 297 298 299 300 301 302 303 304 305 306 307 308 309 310 311 312 313 314 315 316 317 318 319 320 321 322 323 324 325 326 327 328 329 330 331 332 333 334 335 336 337 338 339 340 341 342 343 344 345 346 347 348 349 350 351 352 353 354 355 356 357 358 359 360 361 362 363 364 365 366 367 368 369 370 371 372 373 374 375 376 377 378 379 380 381 382 383 384 385 386 387 388 389 390 391 392 393 394 395 396 397 398 399 400 401 402 403 404 405 406 407 408 409 410 411 412 413 414 415 416 417 418 419 420 421 422 423 424 425 426 427 428 429 430 431 432 433 434 435 436 437 438 439 440 441 442 443 444 445 446 447 448 449 450 451 452 453 454 455 456 457 458 459 460 461 462 463 464 465 466 467 468 469 470 471 472 473 474 475 476 477 478 479 480 481 482 483 484 485 486 487 488 489 490 491 492 493 494 495 496 497 498 499 500 501 502 503 504 505 506 507 508 509 510 511 512 513 514 515 516 517 518 519 520 521 522 523 524 525 526 527 528 529 530 531 532 533 534 535 536 537 538 539 540 541 542 543 544 545 546 547 548 549 550 551 552 553 554 555 556 557 558 559 560 561 562 563 564 565 566 567 |
{ "annotations": { "list": [ { "builtIn": 1, "datasource": "-- Grafana --", "enable": true, "hide": true, "iconColor": "rgba(0, 211, 255, 1)", "name": "Annotations & Alerts", "target": { "limit": 100, "matchAny": false, "tags": [], "type": "dashboard" }, "type": "dashboard" } ] }, "editable": true, "fiscalYearStartMonth": 0, "gnetId": null, "graphTooltip": 1, "iteration": 1677877089957, "links": [], "liveNow": false, "panels": [ { "datasource": null, "fieldConfig": { "defaults": { "color": { "mode": "thresholds" }, "mappings": [], "min": 0, "thresholds": { "mode": "absolute", "steps": [ { "color": "green", "value": null } ] }, "unit": "short" }, "overrides": [] }, "gridPos": { "h": 4, "w": 4, "x": 0, "y": 0 }, "id": 2, "options": { "colorMode": "value", "graphMode": "none", "justifyMode": "center", "orientation": "auto", "reduceOptions": { "calcs": [], "fields": "", "values": false }, "text": {}, "textMode": "auto" }, "pluginVersion": "8.2.6", "targets": [ { "query": "from(bucket: v.defaultBucket)n |> range(start: v.timeRangeStart, stop: v.timeRangeStop)n |> filter(fn: (r) => r["_measurement"] == "http_reqs")n |> filter(fn: (r) => r["testid"] =~ /${testid:regex}/)n |> filter(fn: (r) => r["_field"] == "value")n |> group(columns: ["_measurement"])n |> aggregateWindow(every: v.windowPeriod, fn: sum, createEmpty: false)n |> yield(name: "sum")", "refId": "EACH" } ], "title": "Requests Made", "type": "stat" }, { "datasource": null, "fieldConfig": { "defaults": { "color": { "mode": "thresholds" }, "mappings": [], "min": 0, "thresholds": { "mode": "absolute", "steps": [ { "color": "green", "value": null }, { "color": "red", "value": 1 } ] }, "unit": "short" }, "overrides": [] }, "gridPos": { "h": 4, "w": 4, "x": 4, "y": 0 }, "id": 12, "options": { "colorMode": "value", "graphMode": "none", "justifyMode": "center", "orientation": "auto", "reduceOptions": { "calcs": [], "fields": "", "values": false }, "text": {}, "textMode": "auto" }, "pluginVersion": "8.2.6", "targets": [ { "query": "from(bucket: v.defaultBucket)n |> range(start: v.timeRangeStart, stop: v.timeRangeStop)n |> filter(fn: (r) => r["_measurement"] == "http_req_failed")n |> filter(fn: (r) => r["testid"] =~ /${testid:regex}/)n |> filter(fn: (r) => r["_field"] == "value")n |> group(columns: ["_measurement"])n |> aggregateWindow(every: v.windowPeriod, fn: sum, createEmpty: false)n |> yield(name: "sum")", "refId": "EACH" } ], "title": "HTTP Failures", "type": "stat" }, { "datasource": null, "fieldConfig": { "defaults": { "color": { "mode": "thresholds" }, "mappings": [], "min": 0, "thresholds": { "mode": "absolute", "steps": [ { "color": "green", "value": null } ] }, "unit": "short" }, "overrides": [] }, "gridPos": { "h": 4, "w": 4, "x": 8, "y": 0 }, "id": 13, "options": { "colorMode": "value", "graphMode": "none", "justifyMode": "center", "orientation": "auto", "reduceOptions": { "calcs": [ "max" ], "fields": "", "values": false }, "text": {}, "textMode": "auto" }, "pluginVersion": "8.2.6", "targets": [ { "query": "from(bucket: v.defaultBucket)n |> range(start: v.timeRangeStart, stop: v.timeRangeStop)n |> filter(fn: (r) => r["_measurement"] == "http_reqs")n |> filter(fn: (r) => r["_field"] == "value")n |> filter(fn: (r) => r["testid"] =~ /${testid:regex}/)n |> group()n |> aggregateWindow(every: v.windowPeriod, fn: sum, createEmpty: false)", "refId": "EACH" } ], "title": "Peak RPS", "type": "stat" }, { "datasource": null, "fieldConfig": { "defaults": { "color": { "mode": "thresholds" }, "mappings": [], "min": 0, "thresholds": { "mode": "absolute", "steps": [ { "color": "green", "value": null } ] }, "unit": "ms" }, "overrides": [] }, "gridPos": { "h": 4, "w": 4, "x": 12, "y": 0 }, "id": 14, "options": { "colorMode": "value", "graphMode": "none", "justifyMode": "center", "orientation": "auto", "reduceOptions": { "calcs": [], "fields": "", "values": false }, "text": {}, "textMode": "auto" }, "pluginVersion": "8.2.6", "targets": [ { "query": "from(bucket: v.defaultBucket)n |> range(start: v.timeRangeStart, stop:v.timeRangeStop)n |> filter(fn: (r) => r._measurement == "http_req_duration")n |> filter(fn: (r) => r["testid"] =~ /${testid:regex}/)n |> filter(fn: (r) => r._field == "value")n |> group()n |> quantile(q: 0.95, method: "exact_mean")", "refId": "EACH" } ], "title": "P95 Response Time", "type": "stat" }, { "datasource": null, "fieldConfig": { "defaults": { "color": { "mode": "thresholds" }, "mappings": [], "min": 0, "thresholds": { "mode": "absolute", "steps": [ { "color": "green", "value": null } ] }, "unit": "decbytes" }, "overrides": [] }, "gridPos": { "h": 4, "w": 4, "x": 16, "y": 0 }, "id": 15, "options": { "colorMode": "value", "graphMode": "none", "justifyMode": "center", "orientation": "auto", "reduceOptions": { "calcs": [], "fields": "", "values": false }, "text": {}, "textMode": "auto" }, "pluginVersion": "8.2.6", "targets": [ { "query": "from(bucket: v.defaultBucket)n |> range(start: v.timeRangeStart, stop:v.timeRangeStop)n |> filter(fn: (r) => r._measurement == "data_received")n |> filter(fn: (r) => r["testid"] =~ /${testid:regex}/)n |> filter(fn: (r) => r._field == "value")n |> group()n |> sum()", "refId": "EACH" } ], "title": "Data Received", "type": "stat" }, { "datasource": null, "fieldConfig": { "defaults": { "color": { "mode": "thresholds" }, "mappings": [], "min": 0, "thresholds": { "mode": "absolute", "steps": [ { "color": "green", "value": null } ] }, "unit": "decbytes" }, "overrides": [] }, "gridPos": { "h": 4, "w": 4, "x": 20, "y": 0 }, "id": 16, "options": { "colorMode": "value", "graphMode": "none", "justifyMode": "center", "orientation": "auto", "reduceOptions": { "calcs": [], "fields": "", "values": false }, "text": {}, "textMode": "auto" }, "pluginVersion": "8.2.6", "targets": [ { "query": "from(bucket: v.defaultBucket)n |> range(start: v.timeRangeStart, stop:v.timeRangeStop)n |> filter(fn: (r) => r._measurement == "data_sent")n |> filter(fn: (r) => r["testid"] =~ /${testid:regex}/)n |> filter(fn: (r) => r._field == "value")n |> group()n |> sum()", "refId": "EACH" } ], "title": "Data Sent", "type": "stat" }, { "datasource": null, "fieldConfig": { "defaults": { "color": { "mode": "palette-classic" }, "custom": { "axisLabel": "", "axisPlacement": "left", "barAlignment": 0, "drawStyle": "line", "fillOpacity": 0, "gradientMode": "none", "hideFrom": { "legend": false, "tooltip": false, "viz": false }, "lineInterpolation": "linear", "lineWidth": 1, "pointSize": 5, "scaleDistribution": { "type": "linear" }, "showPoints": "auto", "spanNulls": false, "stacking": { "group": "EACH", "mode": "none" }, "thresholdsStyle": { "mode": "off" } }, "displayName": "${__field.labels.id}", "mappings": [], "min": 0, "thresholds": { "mode": "absolute", "steps": [ { "color": "green", "value": null }, { "color": "red", "value": 80 } ] }, "unit": "short" }, "overrides": [ { "matcher": { "id": "byFrameRefID", "options": "VUS" }, "properties": [ { "id": "displayName", "value": "Active VUs" }, { "id": "custom.lineStyle", "value": { "dash": [ 10, 10 ], "fill": "dash" } }, { "id": "color", "value": { "fixedColor": "orange", "mode": "fixed" } } ] }, { "matcher": { "id": "byFrameRefID", "options": "RPS" }, "properties": [ { "id": "displayName", "value": "RPS" } ] }, { "matcher": { "id": "byFrameRefID", "options": "EACH" }, "properties": [ { "id": "unit", "value": "ms" }, { "id": "custom.axisPlacement", "value": "right" } ] }, { "matcher": { "id": "byFrameRefID", "options": "ALL" }, "properties": [ { "id": "unit", "value": "ms" }, { "id": "displayName", "value": "ALL" } ] } ] }, "gridPos": { "h": 11, "w": 24, "x": 0, "y": 4 }, "id": 11, "options": { "legend": { "calcs": [ "min", "mean", "max", "lastNotNull" ], "displayMode": "table", "placement": "bottom" }, "tooltip": { "mode": "multi" } }, "pluginVersion": "8.3.1", "targets": [ { "hide": false, "query": "from(bucket: v.defaultBucket)n |> range(start: v.timeRangeStart, stop:v.timeRangeStop)n |> filter(fn: (r) => r._measurement == "http_req_duration")n |> filter(fn: (r) => r["testid"] =~ /${testid:regex}/)n |> filter(fn: (r) => r._field == "value")n |> filter(fn: (r) => r.status == "200")n |> group(columns: ["all"], mode:"by")n |> aggregateWindow(every: v.windowPeriod, fn: mean, createEmpty: false)n |> yield(name: "mean")n", "refId": "ALL" }, { "hide": false, "query": "from(bucket: v.defaultBucket)n |> range(start: v.timeRangeStart, stop:v.timeRangeStop)n |> filter(fn: (r) => r._measurement == "http_req_duration")n |> filter(fn: (r) => r["testid"] =~ /${testid:regex}/)n |> filter(fn: (r) => r._field == "value")n |> filter(fn: (r) => r.status == "200")n |> aggregateWindow(every: v.windowPeriod, fn: mean, createEmpty: false)n |> yield(name: "mean")", "refId": "EACH" }, { "hide": false, "query": "from(bucket: v.defaultBucket)n |> range(start: v.timeRangeStart, stop:v.timeRangeStop)n |> filter(fn: (r) => r["_measurement"] == "vus")", "refId": "VUS" }, { "hide": false, "query": "from(bucket: v.defaultBucket)n |> range(start: v.timeRangeStart, stop: v.timeRangeStop)n |> filter(fn: (r) => r["_measurement"] == "http_reqs")n |> filter(fn: (r) => r["testid"] =~ /${testid:regex}/)n |> filter(fn: (r) => r["_field"] == "value")n |> group(columns: ["_measurement"])n |> aggregateWindow(every: 1s, fn: sum, createEmpty: false)n |> yield(name: "sum")", "refId": "RPS" } ], "type": "timeseries" } ], "refresh": false, "schemaVersion": 32, "style": "dark", "tags": [], "templating": { "list": [ { "allValue": null, "current": { "selected": false, "text": "All", "value": "$__all" }, "datasource": null, "definition": "import "influxdata/influxdb/schema"nschema.tagValues(bucket: v.defaultBucket, tag: "testid")", "description": null, "error": null, "hide": 0, "includeAll": true, "label": null, "multi": false, "name": "testid", "options": [], "query": "import "influxdata/influxdb/schema"nschema.tagValues(bucket: v.defaultBucket, tag: "testid")", "refresh": 1, "regex": "", "skipUrlSync": false, "sort": 0, "type": "query" } ] }, "time": { "from": "now-1h", "to": "now" }, "timepicker": {}, "timezone": "", "title": "K6 Test Results", "uid": "4sk8QaJVx", "version": 1 } |
修正後結果
凡例をID毎に設定したことで、各IDのレスポンス速度が可視化できるようになりました。
| 凡例名 | 概要 |
|---|---|
| ALL | 全ID平均の統計値 (クエリを追加) |
| 各ID (タグで変更可能) (凡例を修正) | 対象IDの統計値 |
| Active VUs (Virtual Users) | 動いたVirtual Users の数 |
| RPS (Requests Per Second) | 1秒あたりのリクエスト数 |
- 修正前
- 修正後
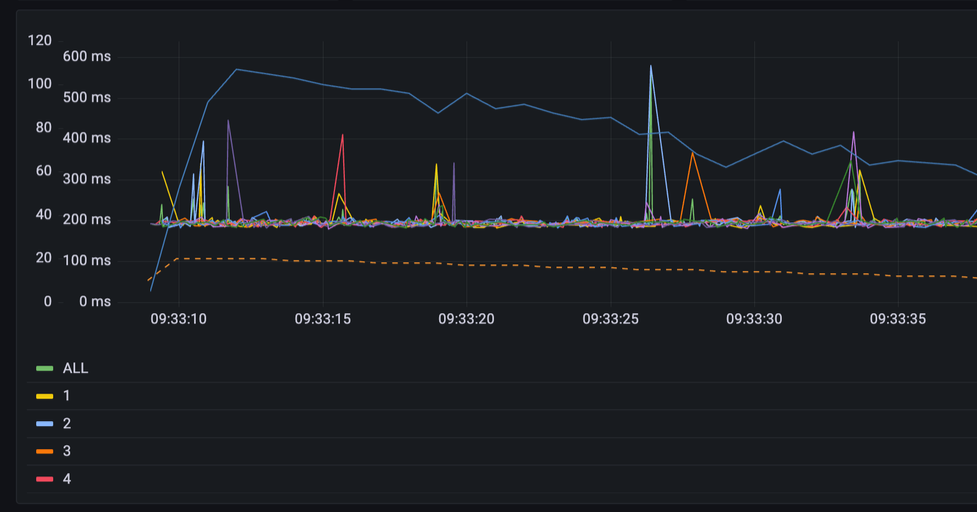
全APIのレスポンスの平均速度
別途クエリを作成し表示しています。
毎秒毎に平均を算出したことで、全IDの平均値の推移を可視化するようにしました。
このAPIでは、レスポンス速度の平均が197msであることがわかり、ほぼ一定の速度を出せていることがわかります。

VUs (Virtual Users)
このグラフは一秒間に何回のアクセスがあったかを表しています。
シナリオの通り、開始2秒でアクセス数が20まで跳ね上がり、その後2分をかけて徐々に数が減っている様相が見て取れます。

RPS (response per second)
直前の一秒間に帰ってきたリクエストの数を返しています。
時間経過で徐々に減少していることが見て取れ、想定通りの挙動をしていることがわかります。

3. データのインポート
コンテナを立ち上げた際に立ち上がっているため、そちらにアクセスします。
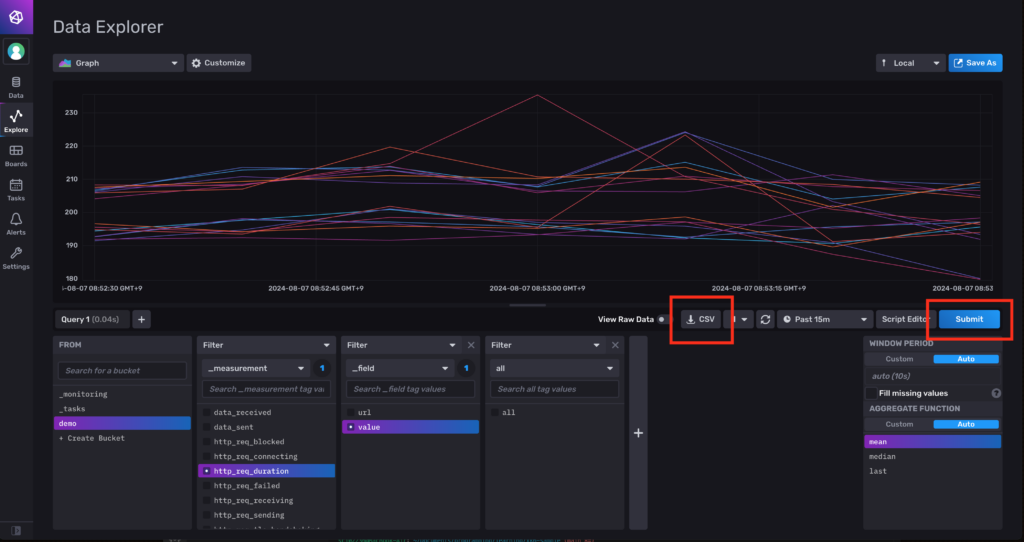
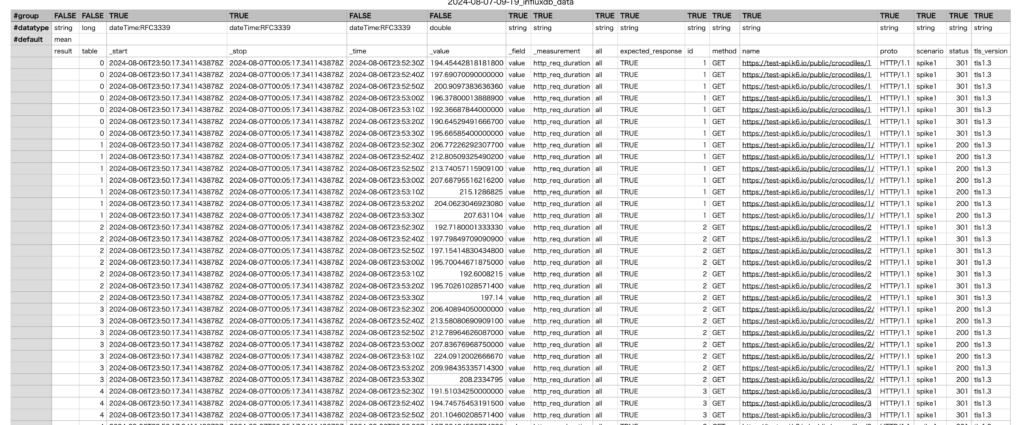
csv形式でデータを保存する場合の手順は以下の通りです。
- influxDB (http://localhost:8086/) にアクセスする
- Data → Buckets → demo に遷移する
- フィルター設定をする (
demo/http_req_durationを選択) (その他フィルターは場合により設定) submitを押す- 下図赤枠のボタンを押す
おわりに
今回はinfluxdb, grafanaを用いたk6の使い方についてまとめてみました。k6は簡単に使えるツールでありながら、非常に強力な負荷テストを実行することができます。influxDBとGrafanaを組み合わせることで、テスト結果を視覚的に分析することも可能になります。
他にも、使用しているサーバーのCPU使用率やRAM使用率の計測や、発生したエラーの調査などのアプローチが必要になります。
はじめにも触れている通り、そういった手順が品質や信頼性の担保に繋がります。システムのパフォーマンスを把握し、潜在的な問題を早期に発見するために非常に重要です。そのため負荷テストは単なる技術的な作業ではなく、ユーザー体験の向上やビジネスの成功に直結する取り組みとなります。
今回紹介した手法を参考に、皆さんのプロジェクトでより安定したシステム運用につなげていただければ幸いです。
次回は、後藤さんです。どんな記事になるか楽しみですね!


