はじめに
こんにちは、ニフティ株式会社 基幹システムグループの石坂です。普段の業務では課金系システムの開発運用をしています。
今回は、社内のサーバーを監視するためにPrometheusを触ってみましたので、共有したいと思います。
Prometheusとは
PrometheusはOSSのリソース監視システムです。
監視対象に監視エージェント(Exporter)を入れることでHTTP経由でメトリクス収集を行います。Exporterには様々な種類がありますが、今回はログ監視に用いるgrok-exporterを使ってみます。
また、Prometheusには収集したデータをグラフ表示する機能がありますが、Prometheus単体だと機能が充実していません。そのため、データ可視化ツールであるGrafanaと組み合わせて使われることが多いようです。
実際にログ監視してみる
Prometheusはdockerイメージが提供されているため、ローカルで簡単に試すことができます。今回はPrometheus、Grafana、監視対象としてCentOSのコンテナをdocker-composeを用いて起動します。
docker-compose.yml
監視対象のサーバーを「target-server」としています。
|
1 2 3 4 5 6 7 8 9 10 11 12 13 14 15 16 17 18 19 20 21 22 23 24 25 26 27 28 |
version: '3' services: prometheus: image: prom/prometheus:v2.41.0 container_name: prometheus volumes: - ./:/etc/prometheus/ - ./prometheus-data:/prometheus ports: - 9090:9090 network_mode: dockernet grafana: image: grafana/grafana:8.5.2 container_name: grafana volumes: - ./grafana-data:/var/lib/grafana ports: - 3000:3000 network_mode: dockernet target-server: image: centos:centos7 tty: true container_name: target-server ports: - 9144:9144 network_mode: dockernet |
prometheus.yml
Prometheusの設定ファイルです。監視対象のサーバーをここに記載しておきます。
|
1 2 3 4 5 6 7 8 9 |
global: scrape_interval: 15s external_labels: monitor: 'codelab-monitor' scrape_configs: - job_name: 'prometheus-test' static_configs: - targets: ['target-server:9144'] |
それでは実際に起動していきます。
|
1 |
docker compose up -d |
監視対象サーバーに入ってgrok_exporterをインストールします。
|
1 |
docker exec -it -u 0 target-server bash |
|
1 2 3 4 5 6 7 |
[root@9deda05f745d /]# yum install -y wget [root@9deda05f745d /]# cd usr/local/src/ [root@9deda05f745d src]# wget https://github.com/fstab/grok_exporter/releases/download/v1.0.0.RC5/grok_exporter-1.0.0.RC5.linux-amd64.zip [root@9deda05f745d src]# yum install -y unzip [root@9deda05f745d src]# unzip grok_exporter-1.0.0.RC5.linux-amd64.zip [root@9deda05f745d src]# mv grok_exporter-1.0.0.RC5.linux-amd64 ../grok_exporter [root@9deda05f745d src]# |
以下が今回ログ監視したいサンプルログファイルとなります。
|
1 2 3 4 5 6 7 8 |
[root@9deda05f745d src]# cd ../grok_exporter [root@9deda05f745d grok_exporter]# head -5 example/exim-rejected-RCPT-examples.log 2016-04-18 09:33:27 H=(○○○.○○○.○○○.○○○) [○○○.○○○.○○○.○○○] F=<z2007tw@○○○.com.tw> rejected RCPT <alan.a168@○○○.net>: relay not permitted 2016-04-18 12:28:04 H=(○○○.○○○.○○○.○○○) [○○○.○○○.○○○.○○○] F=<z2007tw@○○○.com.tw> rejected RCPT <alan.a168@○○○.net>: relay not permitted 2016-04-18 19:16:30 H=(○○○.○○○.○○○.○○○) [○○○.○○○.○○○.○○○] F=<z2007tw@○○○.com.tw> rejected RCPT <alan.a168@○○○.net>: relay not permitted 2016-04-18 19:26:22 H=(○○○.○○○.○○○.○○○) [○○○.○○○.○○○.○○○] F=<z2007tw@○○○.com.tw> rejected RCPT <alan.a168@○○○.net>: relay not permitted 2016-04-26 04:41:25 H=(○○○.○○○.○○○.○○○) [○○○.○○○.○○○.○○○] F=<z2007tw@○○○.com.tw> rejected RCPT <alan.a168@○○○.net>: relay not permitted [root@9deda05f745d grok_exporter]# |
以下の設定ファイルに監視設定を記載します。
metricsのtypeで監視対象ログから取得する値の種類を指定することができます。
サンプルでは、typeを「counter」として、エラーログの件数を取得する設定が記載されています。
typeには他にもgaugeやhistogram、summaryなどがあり、例えばgaugeを指定すると、一致する各ログ行で記録される数値を取得することができます。
|
1 2 3 4 5 6 7 8 9 10 11 12 13 14 15 16 17 18 19 20 21 22 23 24 |
[root@9deda05f745d grok_exporter]# cat example/config.yml global: config_version: 3 input: type: file path: ./example/exim-rejected-RCPT-examples.log readall: true # Read from the beginning of the file? False means we start at the end of the file and read only new lines. imports: - type: grok_patterns dir: ./patterns grok_patterns: - 'EXIM_MESSAGE [a-zA-Z ]*' metrics: - type: counter name: exim_rejected_rcpt_total help: Total number of rejected recipients, partitioned by error message. match: '%{EXIM_DATE} %{EXIM_REMOTE_HOST} F=<%{EMAILADDRESS}> rejected RCPT <%{EMAILADDRESS}>: %{EXIM_MESSAGE:message}' labels: error_message: '{{.message}}' logfile: '{{base .logfile}}' server: protocol: http port: 9144 [root@9deda05f745d grok_exporter]# |
設定ファイルを指定してgrok_exporterを起動します。
|
1 |
[root@9deda05f745d grok_exporter]# /usr/local/grok_exporter/grok_exporter --config=/usr/local/grok_exporter/example/config.yml & |
Grafanaにログインします。(username: admin / password: admin)
|
1 |
http://localhost:3000/login |
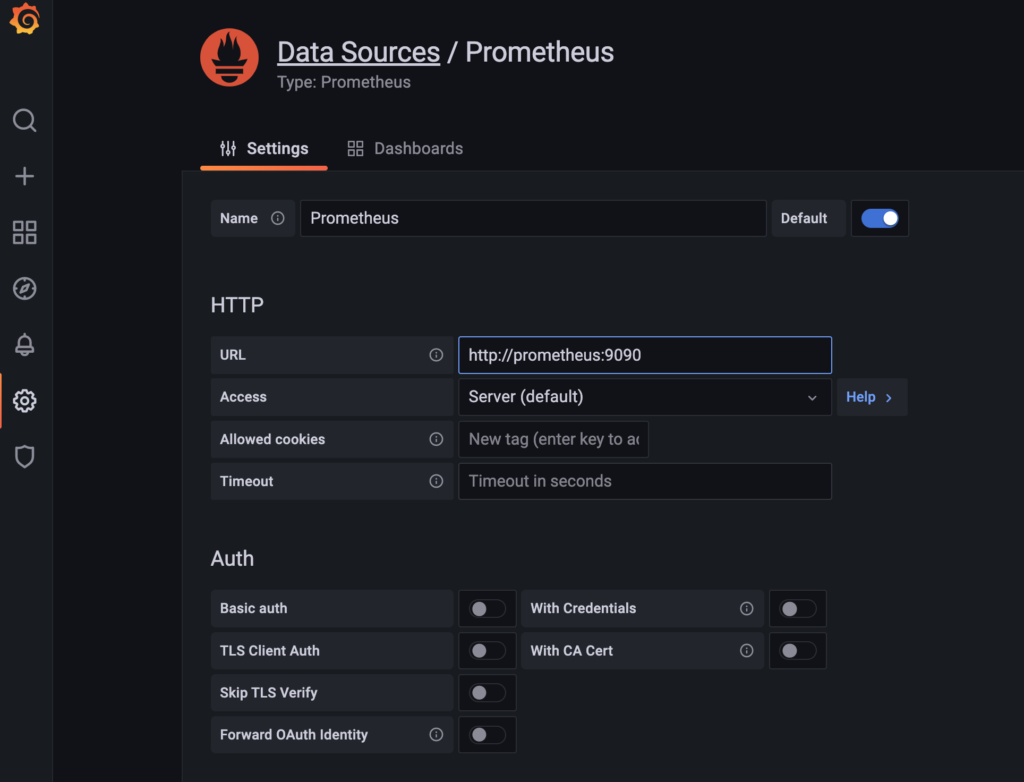
データソースとしてPrometheusを設定します。
設定→Configuration→Add data sourceから、Prometheusを選択して画像のようにURLを設定。Save&testを押下したら紐付け完了です。

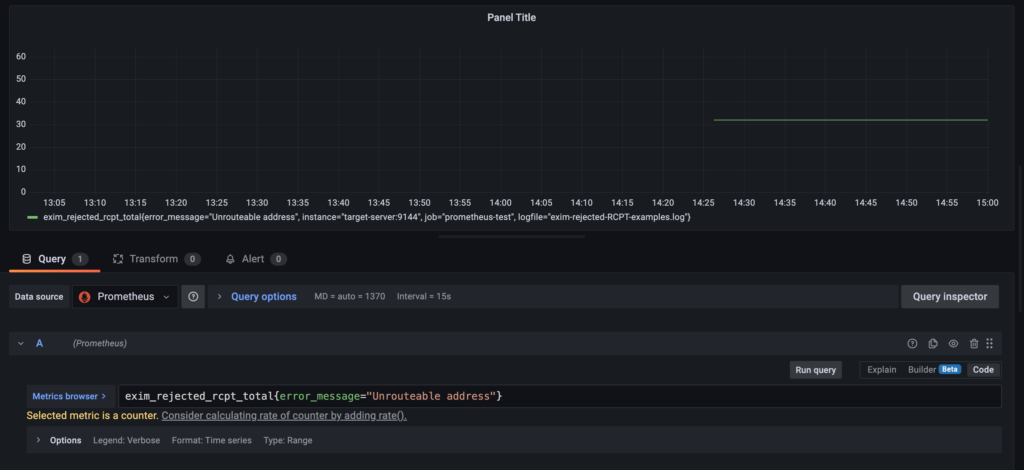
あとはDashboardからPanelを追加して、可視化したいメトリクスを指定することでグラフを表示することができます。
以下の画像は「Unrouteable address」のサンプルエラーログが何件発生してるかを表示しています。

おわりに
PrometheusやGrafanaは今も頻繁にアップデートされており、UIや仕様変更が多いため、参考にできるナレッジが少ない印象でした。
ですが、今回dockerで試してみたように動作確認することは比較的やりやすいので、興味のある方は一度触ってみると面白いかもしれません。


